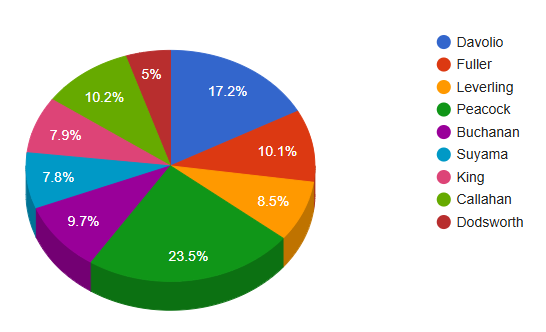
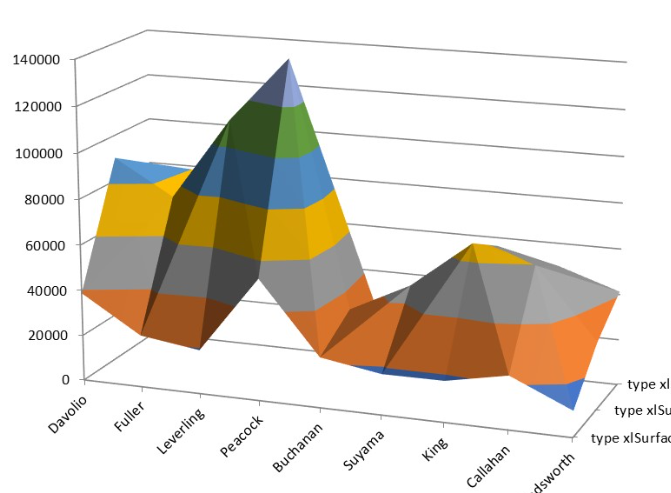
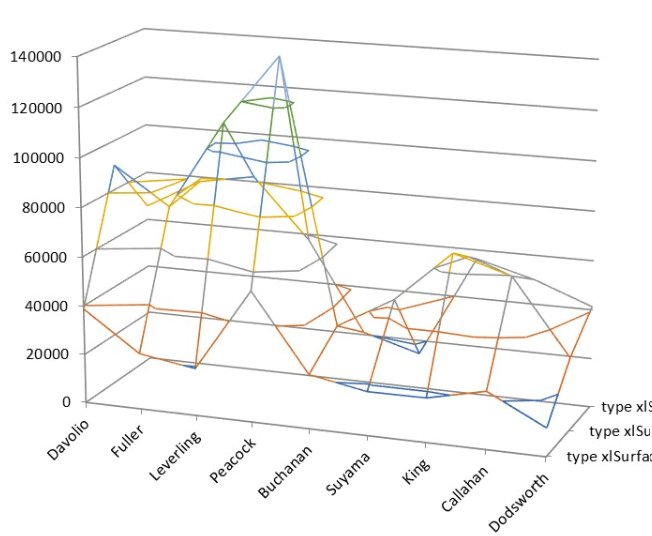
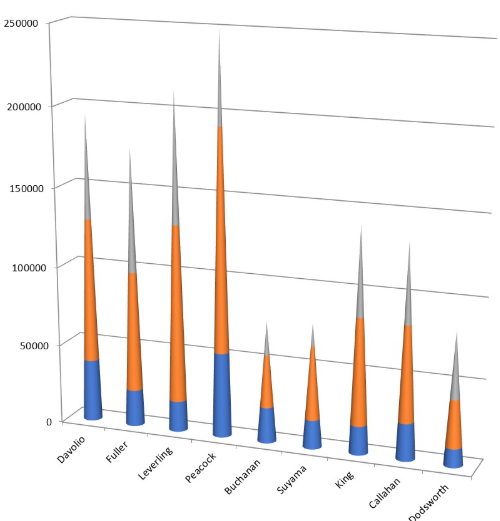
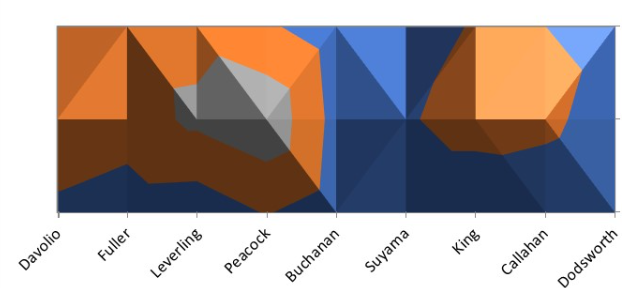
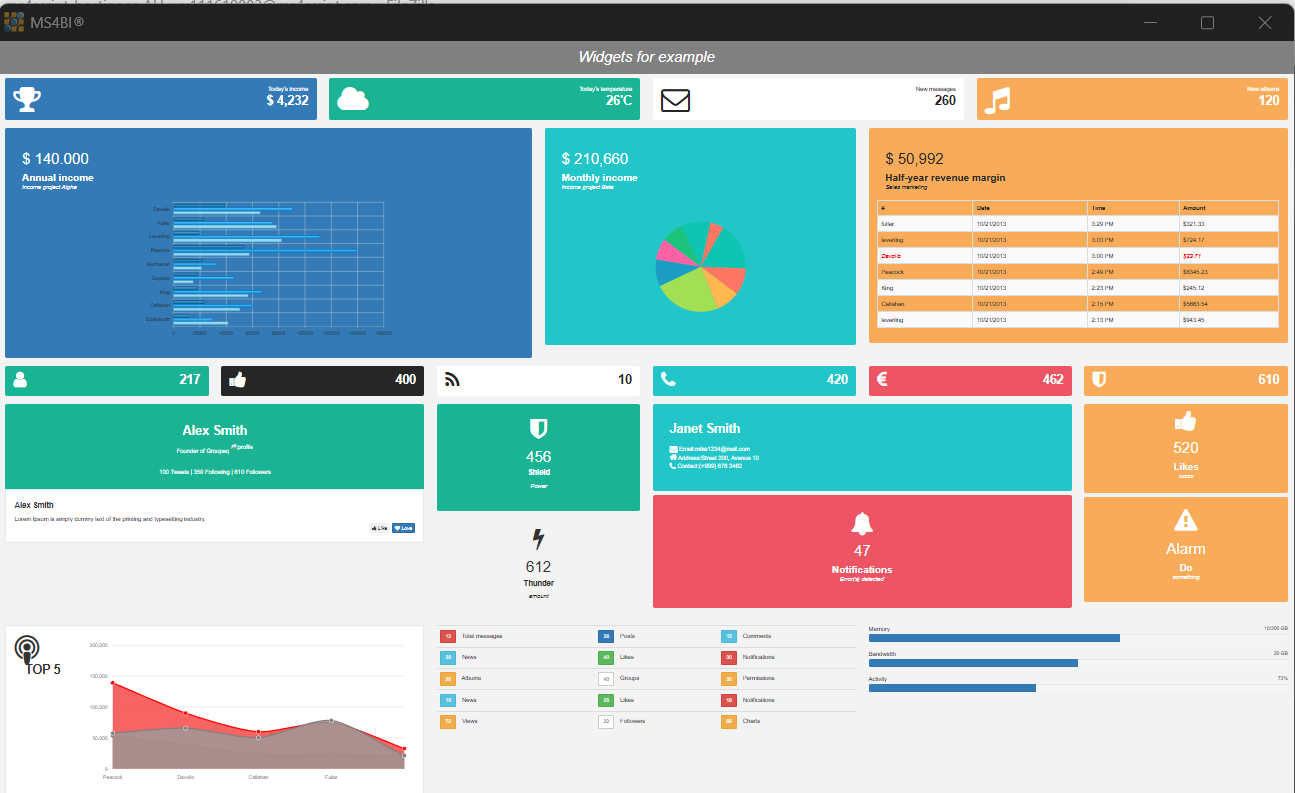
MS4BI Charts
Leverage 8 major graphical libraries with a unique syntax through MS4BI to create powerful visuals.
✔ DataVision, ✔ Scalable, ✔ Innovation
✔ DataVision, ✔ Scalable, ✔ Innovation
Create impressive charts and visualizations without any technical skills using MS4Designer.
Customize and enhance your charts to meet the most complex needs with MS4Script.
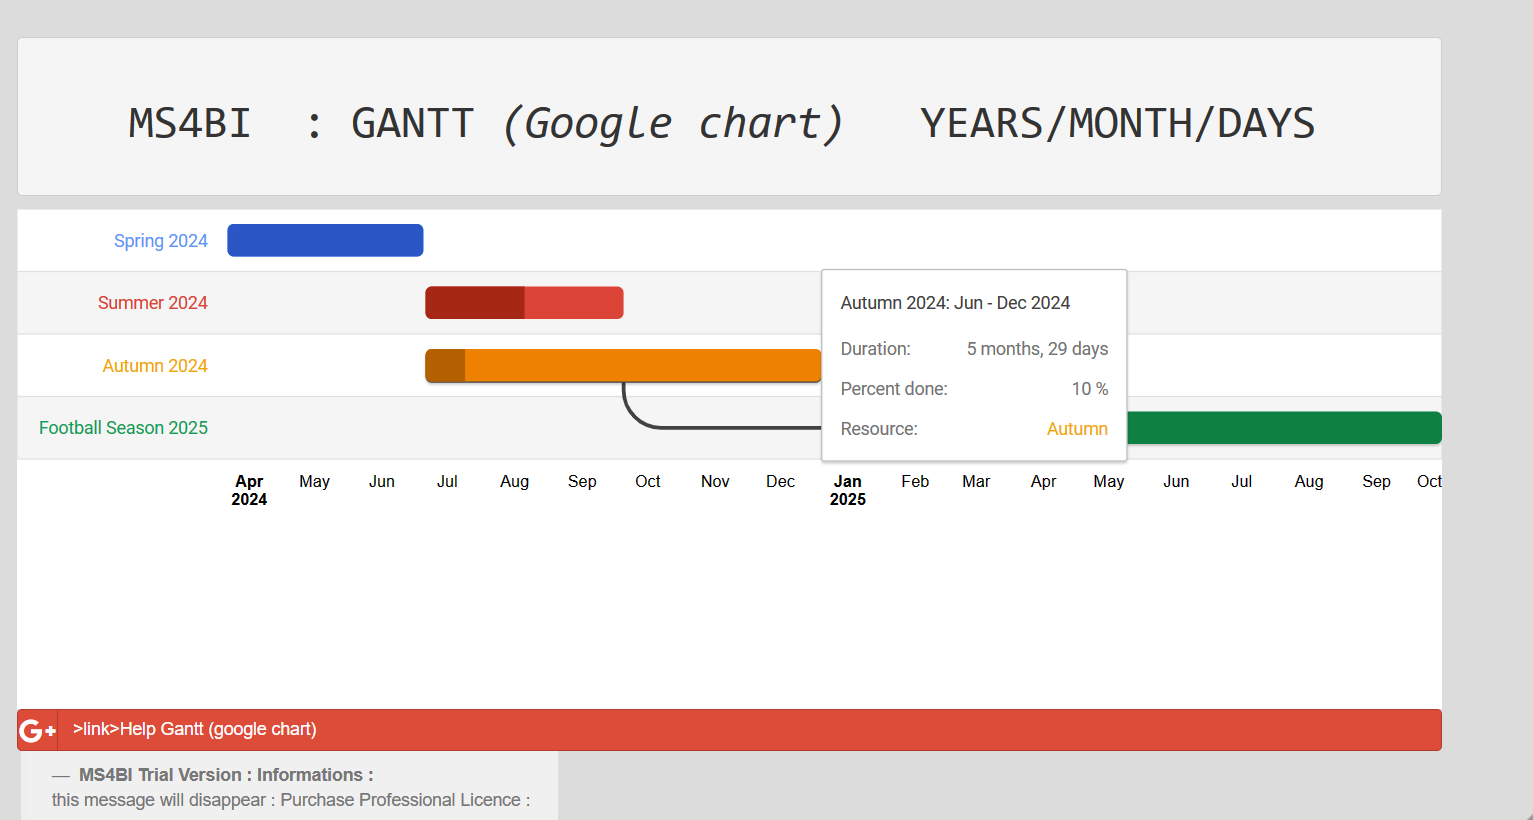
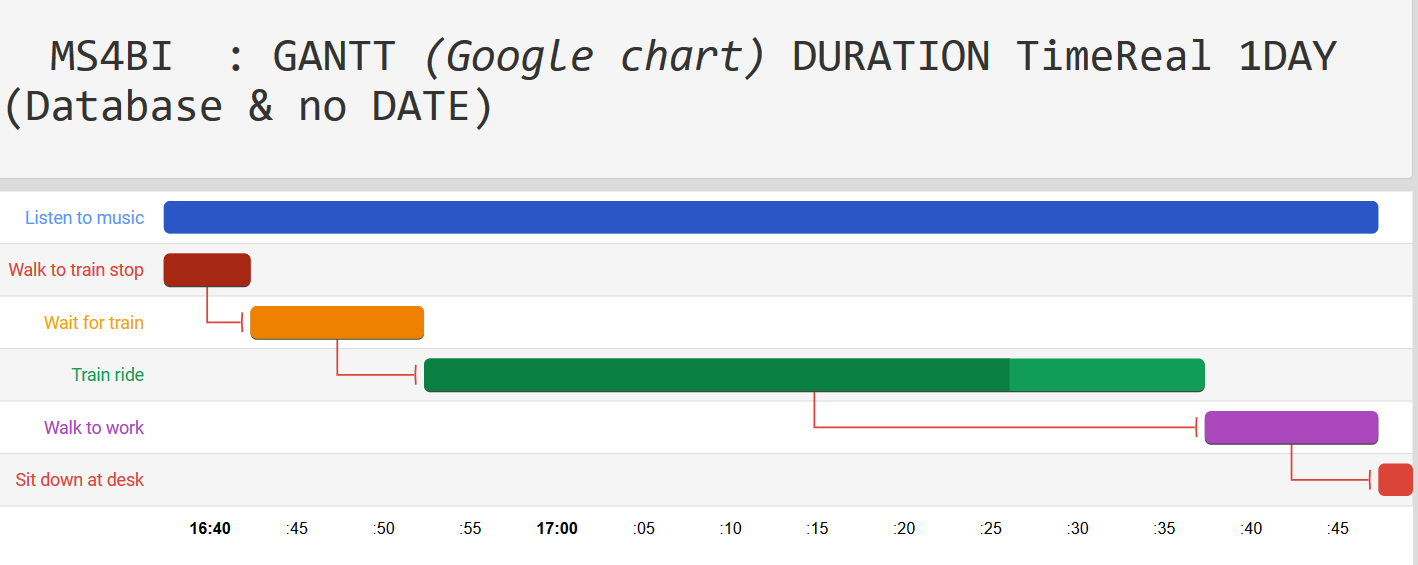
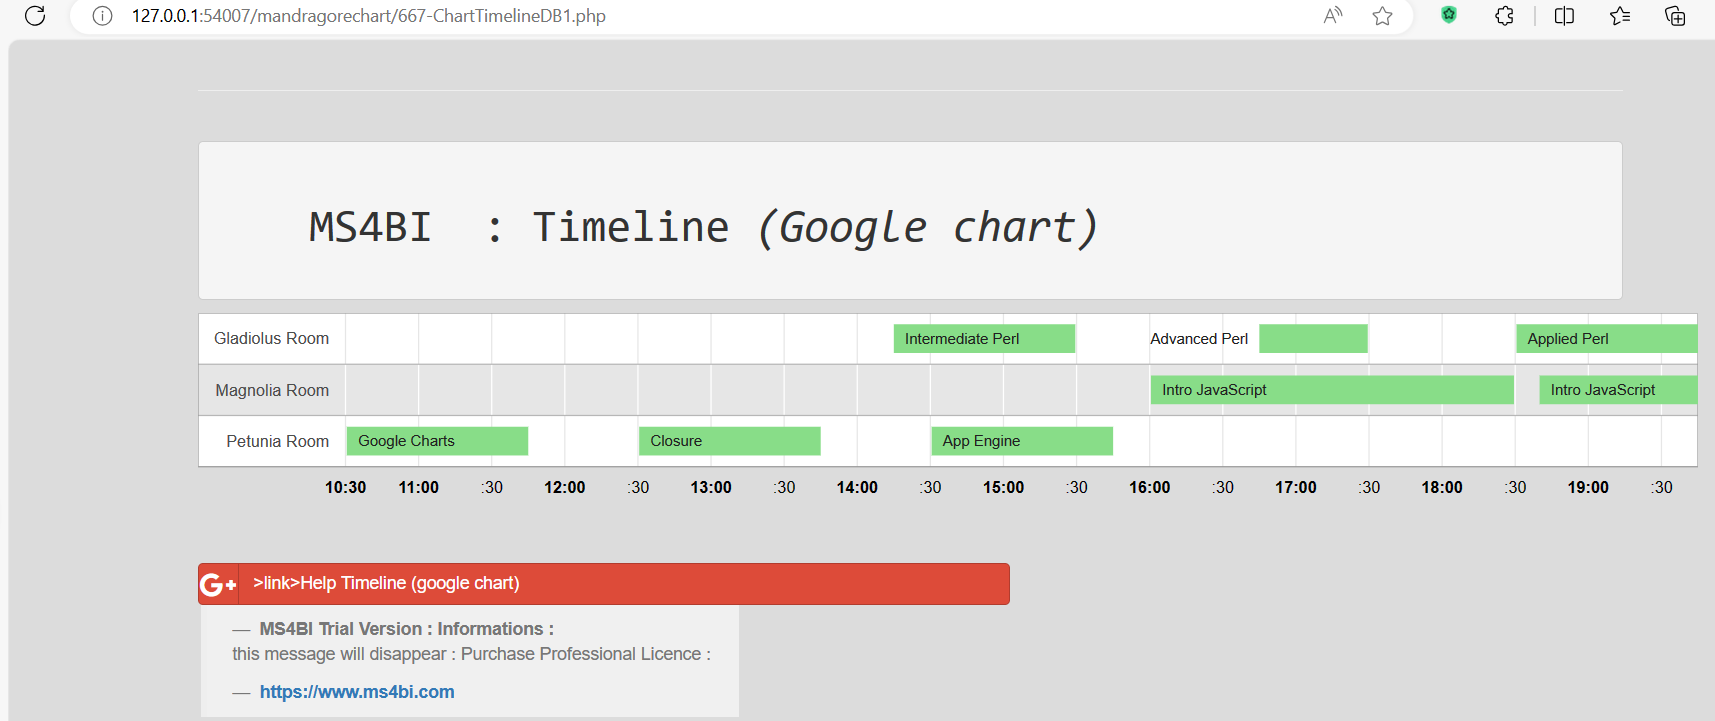
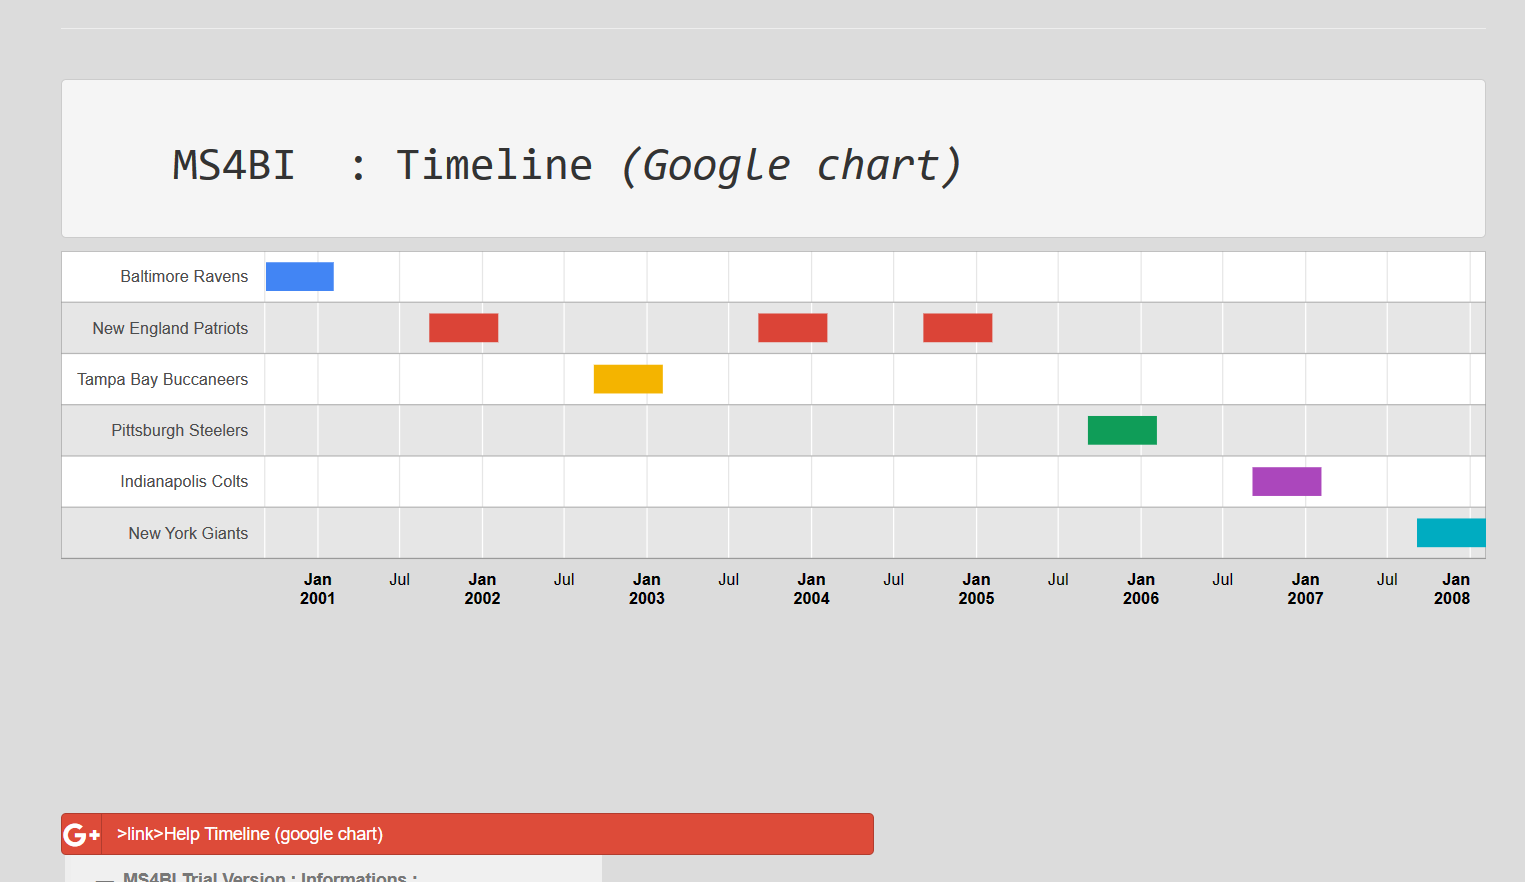
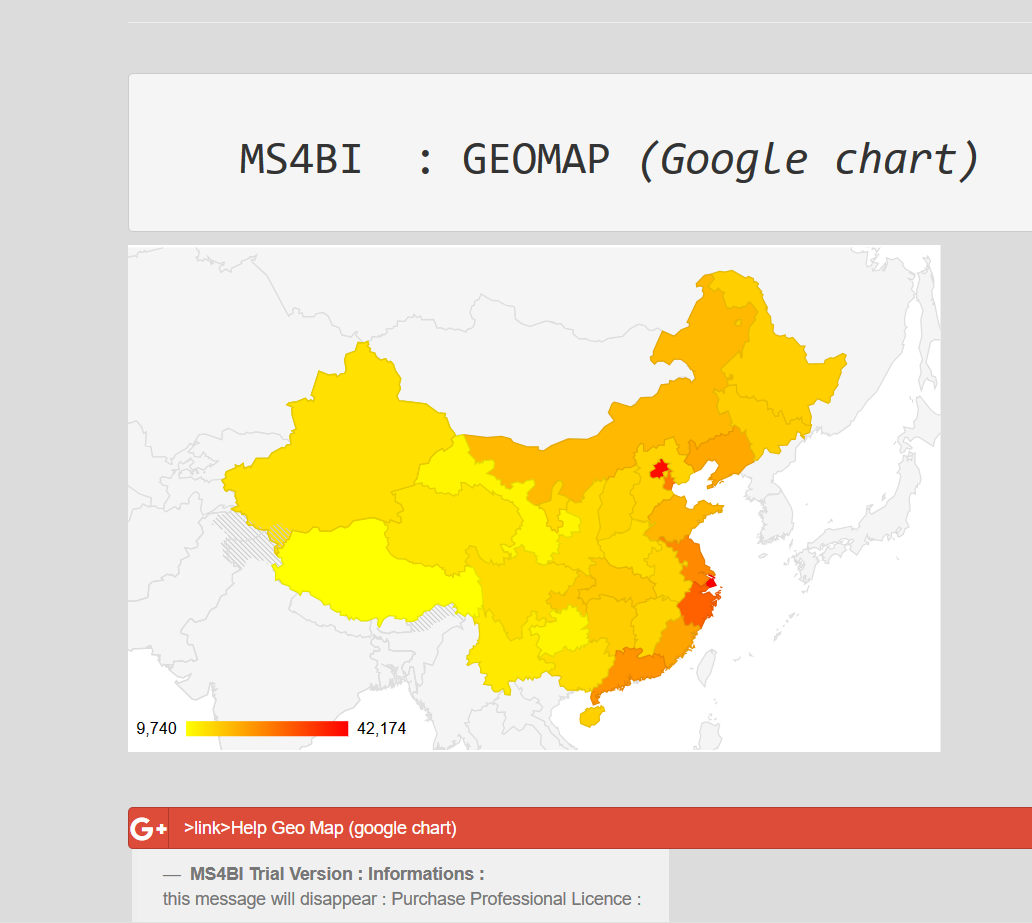
MS4BI provides a unique syntax for creating charts, regardless of the library used, thanks to MS4Script FORM anchors.
Take advantage of MS4BI’s constant updates to integrate new libraries and enrich your charts effortlessly.
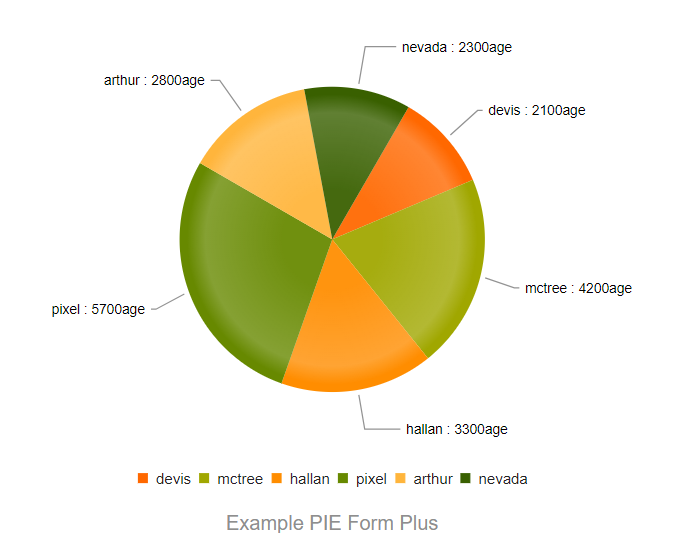
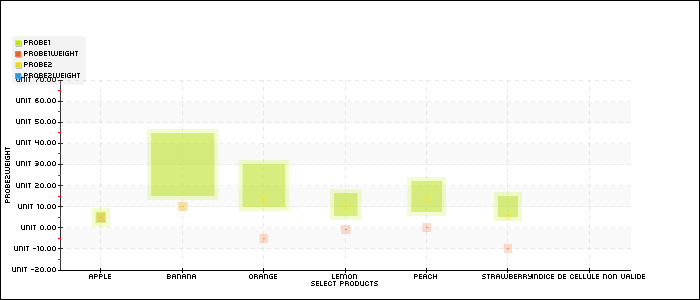
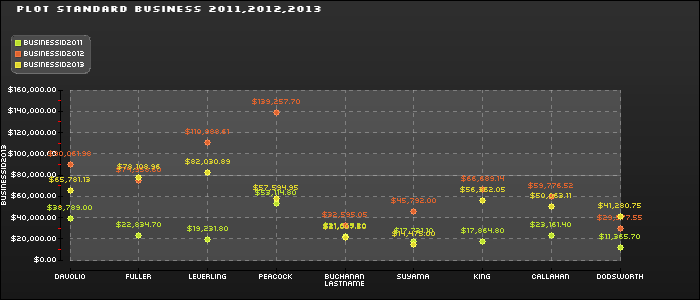
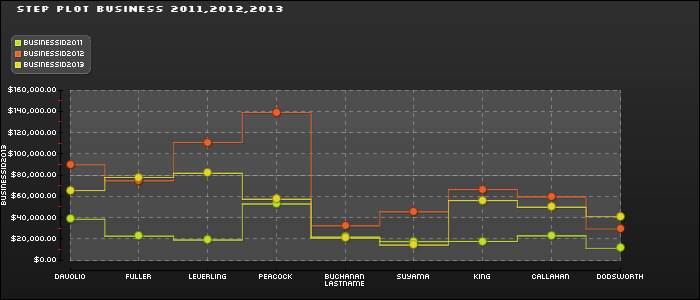
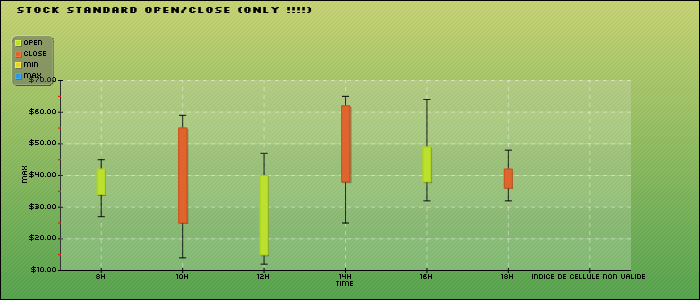
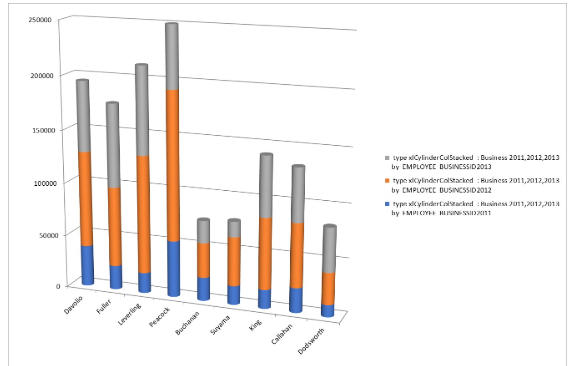
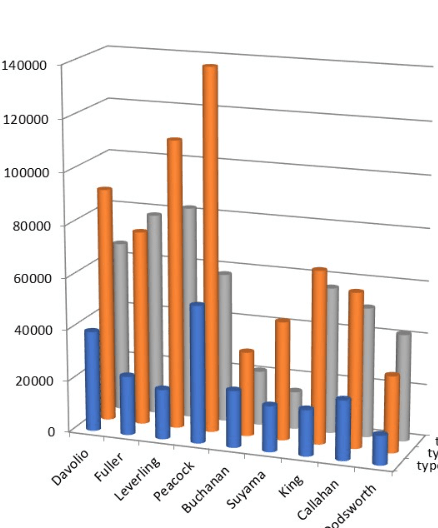
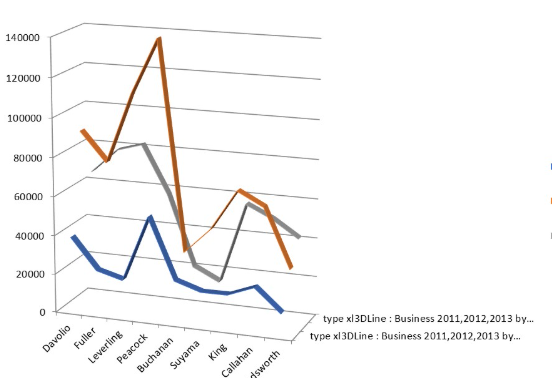
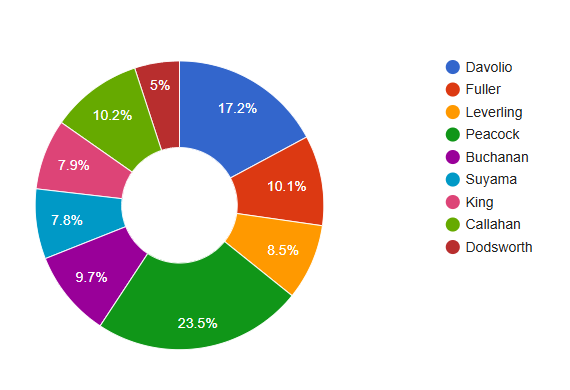
The MS4BI team creates powerful anchors like Form Plus, Form Excel, Form Morris, and more to encapsulate existing libraries. Enjoy unified syntax, regardless of the chart type, thanks to MS4Script and its advanced functions.
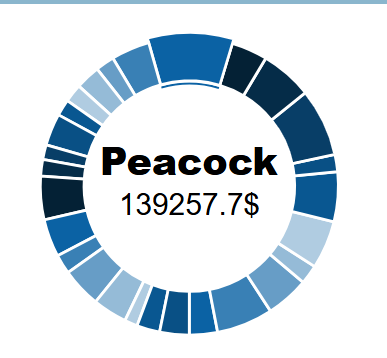
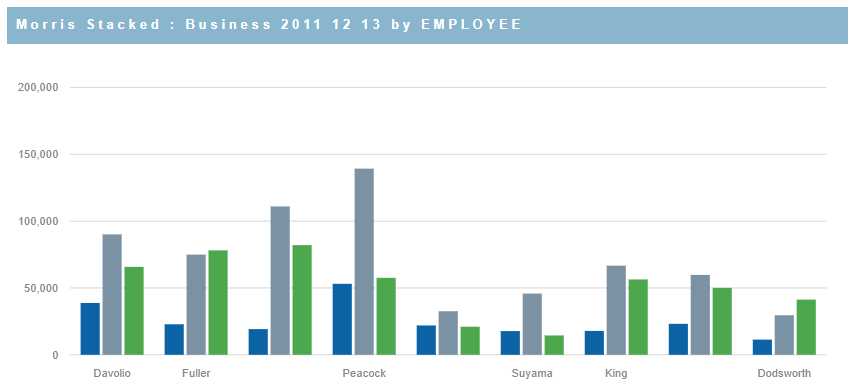
FormGoogle : DrawPIE  , width : "1200px"  title :"PIE --(google chart)--",
ANGLE :140 , type : $STANDARD, FORMAT: "$"	use  View  ("[ms4EmplTotalBusiness2011]");

FormPlus  : DrawBAR, title : "BAR --(Plus chart)--",
type : $COLUMN , FORMAT :"$" use View   ("[ms4EmplTotalBusiness2012]")  ;


Contact our team or consult our guides to better understand MS4BI.
MS4BI is built on a No Code / Low Code productivity-first approach.
With MS4Script, you can build dashboards, charts, queries, menus, or business apps in just a few lines —
without dealing with web and server technicalities.
Whether you are a developer or a business user, you have the power to create.
Filter demos by category to discover the powerful features of MS4BI.
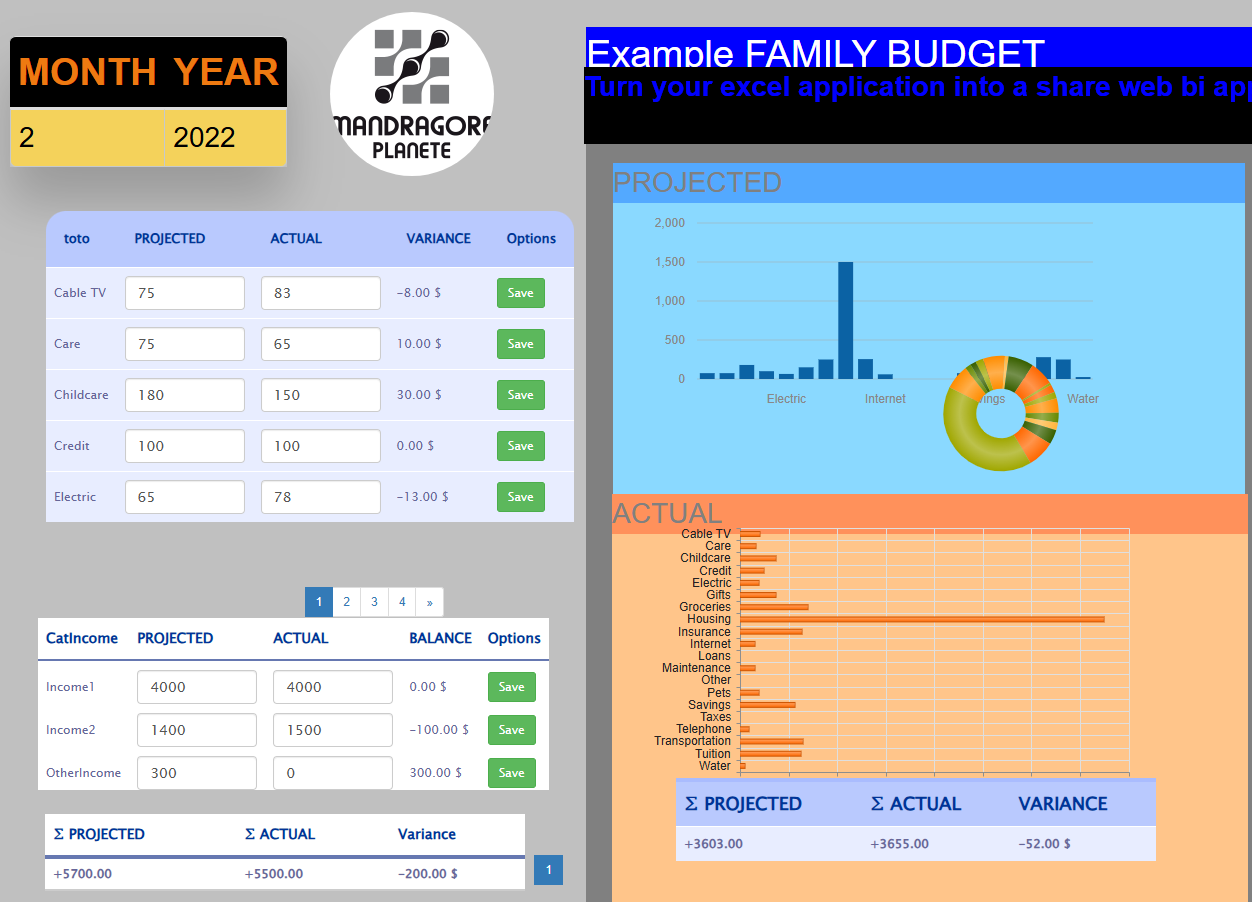
Customized insights in just a few lines of low-code MS4Script.
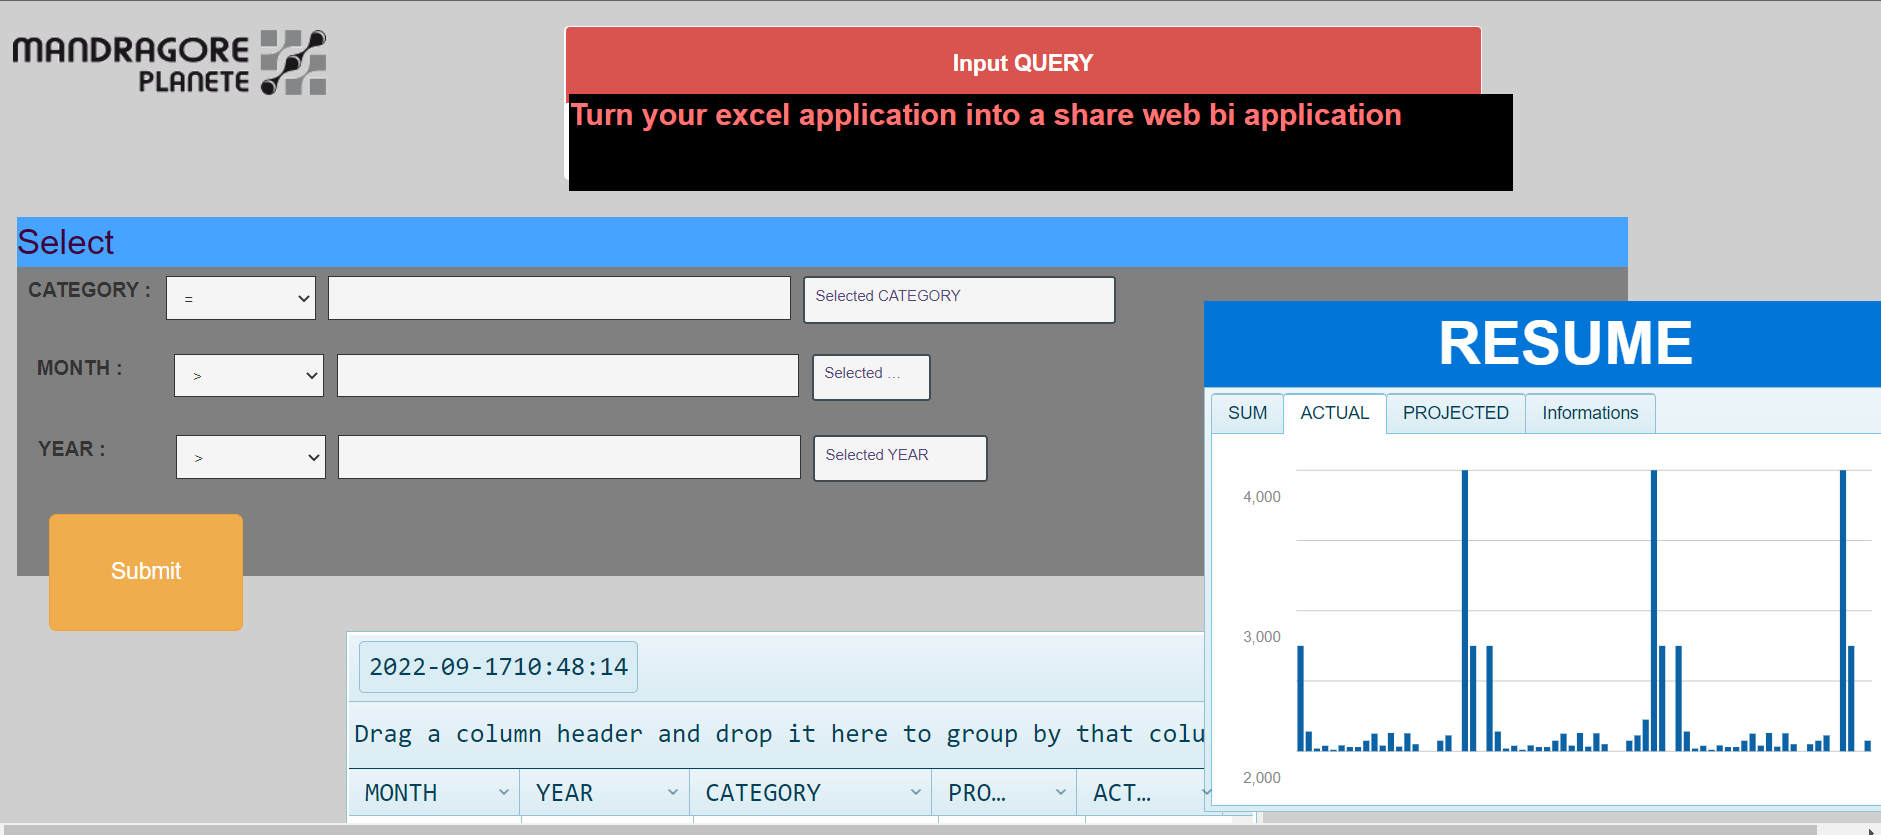
Query your data using MS4Script and its advanced functions.
Visualize your data in real-time with MS4Script and MS4Designer.